
Page 27 - RAFI_ESG_20230919_eng
P. 27
ENVIRONMENTAL MANAGEMENT AND CLIMATE PROTECTION 27
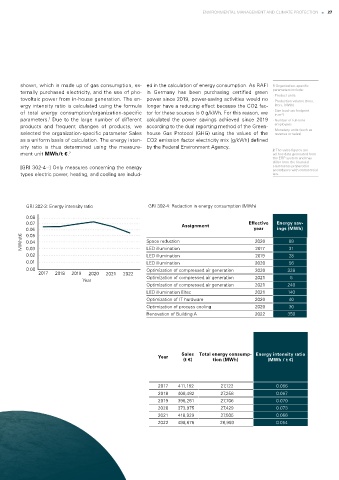
shown, which is made up of gas consumption, ex- ed in the calculation of energy consumption. As RAFI 1 Organization-specific
ternally purchased electricity, and the use of pho- in Germany has been purchasing certified green parameters include:
· Product units
tovoltaic power from in-house generation. The en- power since 2019, power-saving activities would no · Production volume (tons,
ergy intensity ratio is calculated using the formula longer have a reducing effect because the CO2 fac- liters, MWh)
of total energy consumption/organization-specific tor for these sources is 0 g/kWh. For this reason, we · Size (such as footprint
in m²)
1
parameters. Due to the large number of different calculated the power savings achieved since 2019 · Number of full-time
products and frequent changes of products, we according to the dual reporting method of the Green- employees
selected the organization-specific parameter Sales house Gas Protocol (GHG) using the values of the · Monetary units (such as
revenue or sales)
as a uniform basis of calculation. The energy inten- CO2 emission factor electricity mix [g/kWh] defined
sity ratio is thus determined using the measure- by the Federal Environment Agency. 2 The sales figures are
ment unit MWh/t €. 2 ad-hoc data generated from
the ERP system and may
differ from the financial
[GRI 302-4 ] Only measures concerning the energy statements prepared in
accordance with commercial
types electric power, heating, and cooling are includ- law.
GRI 302-3: Energy intensity ratio GRI 302-4: Reduction in energy consumption (MWh)
0.08
0.07 Assignment Effective Energy sav-
0.06 year ings (MWh)
0.05
MWh/t€ 0.04 Space reduction 2020 88
2017
31
0.03
LED illumination
0.02 LED illumination 2019 28
0.01 LED illumination 2020 56
0.00 Optimization of compressed air generation 2020 328
2017 2018 2019 2020 2021 2022
Year Optimization of compressed air generation 2021 5
Optimization of compressed air generation 2021 240
LED illumination Eltec 2021 140
Optimization of IT hardware 2020 40
Optimization of process cooling 2020 30
Renovation of Building A 2022 350
Sales Total energy consump- Energy intensity ratio
Year
(t €) tion (MWh) (MWh / t €)
2017 411,192 27,122 0.066
2018 408,482 27,258 0.067
2019 396,261 27,706 0.070
2020 373,975 27,429 0.073
2021 418,929 27,505 0.066
2022 498,675 26,993 0.054